
![]()
ISS 2017 Debugger software with Intel SVT Closed
Chassis Adapter (CCA) and ITP-XDP3 JTAG Probe.
Sasby Island Target
Setup & Demo GUIDE
FlatOak Co.,
Ltd.
![]()
This guide explains the demonstration of the
Intel System Studio 2017 software (i.e. ISS-2017) working with the ITP-XDP3
JTAG probe, and the Intel Silicon Valley Technology Closed Chassis Adapter (SVT
CCA) probe over Intel Direct Connect Interface (DCI).
NOTE: Intel
System Studio 2017 software “Ultimate” version includes the System Debugger 2017
software.
Introduction
This guide describes the setup and demonstration
of the ITP-XDP3
JTAG probe and the SVT CCA with Intel System
Studio 2017 System Debugger software with connection to Intel Sasby Island
target board.
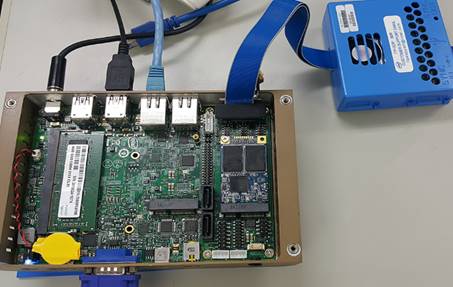
Figure
1: Cable connections between
ITP-XDP3 probe and the Sasby Island target
Hardware
SETUP (ITP-XDP3):
- Host PC running Microsoft Windows.
- ITP-XDP3 JTAG probe with USB cable and A/C power
Adapter. - Intel Sasby Island Device (Intel 7th
generation Kaby Lake processor) with AC adapter.
Hardware cable connection (ITP-XDP3):
- Connect Host PC to ITP-XDP3 probe by USB cable. Connect
AC adapter to probe. - Remove the bottom plate of the device.
- Connect ITP-XDP3 cable to the 60-pin XDP socket
on the target.
Note: Due to placement, it might be necessary to disassemble the Wi-Fi
antenna connector in order to properly secure the XDP cable in place. - Power on the Sasby Island Target.
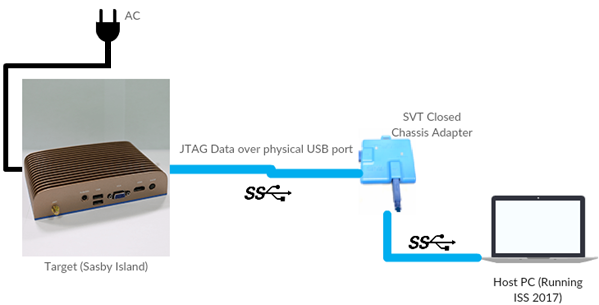
Figure
2: Hardware layout diagram
(CCA-SVT)
Hardware SETUP (CCA-SVT):
- Host PC running
Microsoft Windows. - SVT Closed
Chassis Adapter (CCA) with USB 3.0 cables. - Intel Sasby
Island Device (Intel 7th generation Kaby Lake processor) with
A/C Adapter.
Hardware cable
connections (CCA-SVT):
- Connect Host PC
to CCA probe by USB cable through the “Host” port. - Power on Sasby
Island Target. - Connect CCA
probe to Sasby Island target by USB port through the “Target” port. Note:
Connect the target via USB port 1.
Software SETUP
for DEMO:
- Windows 10 Host PC.
- Install and run ISS 2017. To run System Debugger, simply
go to the Start menu and type “System Debugger”. Choose System
Debugger (Debug) from the menu.
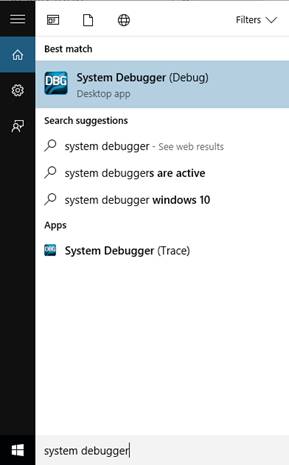
Figure
3: Windows 10 Host - System
Debugger
Confirm
Drivers:
(To open Device Manager, press ![]() +R, then type devmgmt.msc in the dialog box)
+R, then type devmgmt.msc in the dialog box)
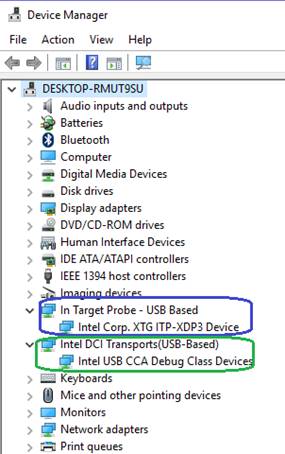
Figure
4: Device Manager with proper
drivers installed and connected
DEMO
STEPS:
Start ISS 2017
Debugger for Core processors.
*Connect the target (ITP-XDP3):
File à Connect à Select Hardware Probe: ITP-XDP3 – In-Target Probe and
the appropriate target platform.
*Connect the target (SVT-CCA):
File à Connect à Select Hardware Probe: Intel(R) DCI OOB and the
appropriate target platform.
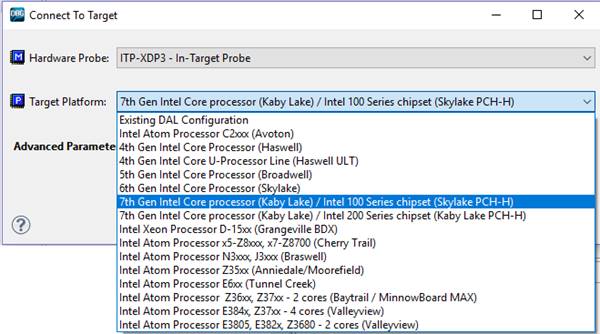
Figure
5: Connecting to target PC
(ITP-XDP3)
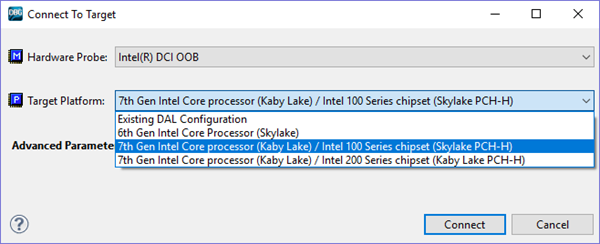
Figure
6: Connecting to target PC (SVT
CCA)
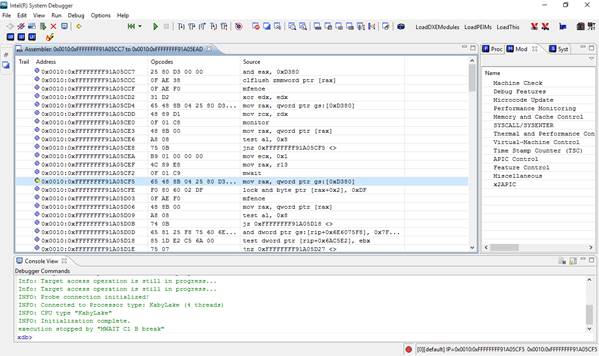
Figure
7: Example of System Debugger
after successful connection to target. Assembler points to entry point
automatically
If you get an error
message while connecting to the device, please reset the target board by
powering it OFF/ON.
NOTE: Below is
explained how to use display toolbar and running toolbar. When closing the
software, the configuration is memorized.

Display Tabs toolbar (or use View menu).
You can setup some
view windows by using the Display tabs.
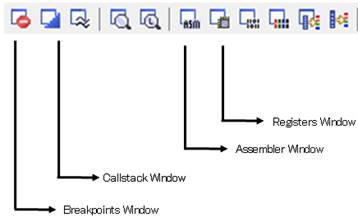
It is recommended to display Source Files, Assembler, Console View and
Breakpoints tabs on your work screen.
Running toolbar is for controlling the debugger.
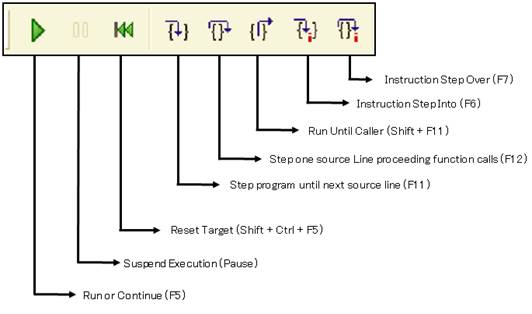
Press STEP![]() , STEP
, STEP![]() , if it moves through line codes, it
, if it moves through line codes, it
confirms good connection.
* Good initial setup is confirmed!
Note: The subsequent steps are identical
for both connectors.
Viewing
Linux kernel source code
System Debugger is
able to link disassembled code obtained from the target with files from kernel
source. To do that, the following items are needed:
–
Linux kernel source
code
–
Symbol file: vmlinux
Kernel source is
located in \usr\src\linux-{kernel_version}, where kernel_version is the target’s
running version of the Linux kernel. If there are no kernel source files
present, download the source files.
On Ubuntu, use the
command $ apt-get source linux-image-$(uname -r)
On openSUSE, use the
command $ zypper in linux-source
On Fedora, invoke the following commands:
$ dnf download –source
kernel
$ rpm –i kernel-*.src.rpm
vmlinux is located
in the /boot directory. If the target uses EFI, it may not be present or
replaced with a vmlinuz file. To compile it, navigate to the kernel source
directory and invoke the command $ make vmlinux
Transfer vmlinux and
kernel source files to the host machine. In System Debugger, go to Options à Source Directories, then in the Rules tab,
click “New”.
Type the original
location of linux source files in the Replace field. It is usually
\usr\src\linux-{version_name}, where {version_name} is the kernel version.

Figure
8: Linking System Debugger to
Linux kernel source files
Connect to the target as shown earlier,
then click ![]() . Browse to the vmlinux directory, then
. Browse to the vmlinux directory, then
click OK. The console should have a message similar to the one shown below:
LOAD :
"C:\Debug\vmlinux"
at 0x0 (= image load base address: 0x0 + offset: 0x0)
System Debugger will load the source code
of the current breakpoint.
Figure
9: Loaded kernel source code
Stopping at kernel initialization
It might be necessary to walk through the kernel initialization to test
for early points of failure while booting. The easiest way to stop at early
kernel initialization is to set a hardware breakpoint in the start_kernel
function main.c within the kernel.
To do so, click ![]() to reset the target and stop
to reset the target and stop
execution by clicking ![]() once the target loads into the
once the target loads into the
bootloader screen.
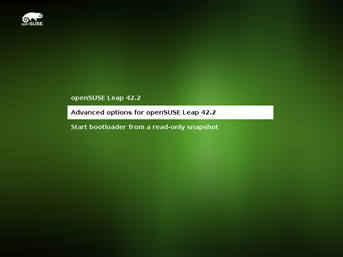
Figure
10: Grub2, the bootloader used
in openSUSE
If not already present,
load vmlinux symbol file (see above) and click View à Source Files to reveal the loaded symbols and source
files.
Navigate to usr\src\linux-{kernel
version}*\init\main.c and search for start_kernel. Then set a breakpoint inside the function
by selecting Debug à Create Breakpoint and write
“main.c”\start_kernel in the Location field, and check ✔ the “Hard” checkbox.
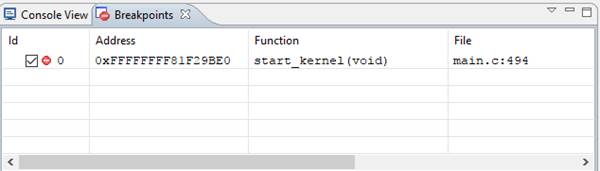
Figure
11: Set breakpoint at kernel
initialization function
Run the target by
clicking ![]() to continue execution. The breakpoint
to continue execution. The breakpoint
will activate and stop at the breakpoint set on start_kernel.
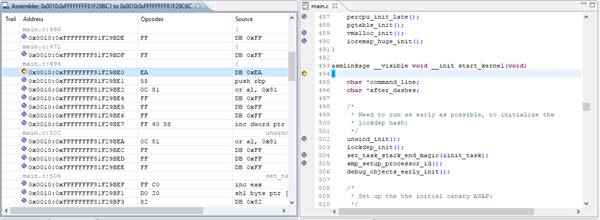
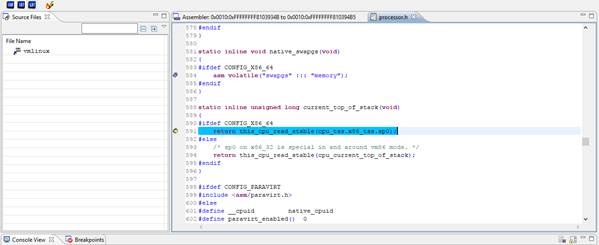
Figure
12: Disassembled code (left)
and C source file (right) at main.c breakpoint
Debugging a Linux kernel module
In order for the
debugger to access information about kernel modules, the kernel module
xdbntf.ko must be loaded on to the target.
The source code for
xdbntf is located in the directory: <install_dir>\System Debugger 2017\system_debug\kernel-modules
(On 64-bit Windows,
<install_dir> is typically C:\Program Files (x86)\IntelSWTools.)
To generate the
kernel object module, transfer the source code to the target machine and invoke
make.
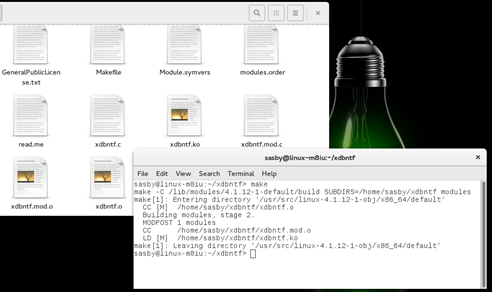
Figure
13: Successfully compiled
kernel module on target PC
Note: Make might fail if:
·
Make, kernel headers,
gcc or other dependencies not installed, or
·
Kernel version > 4.4
To check kernel
version, type uname
–r on terminal. It has to be
4.4 or lower for the kernel object to compile successfully.
After the module is
compiled, load the kernel using $ insmod xdbntf.ko. This command requires root privileges. The
Linux target will freeze after loading the module. In System Debugger, click ![]() to send a stop command to the target.
to send a stop command to the target.
The debugger will
load the kernel object modules information but the target will revert to a
running state. Click ![]() again to stop the target and reload
again to stop the target and reload
machine code. If Linux Kernel Modules window was not present, click View à Linux Kernel Modules.
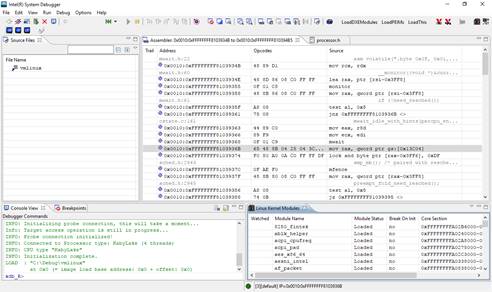
Figure
14: Loaded Linux kernel module
information
To set a breakpoint
on a particular kernel module, right click the kernel modules window and select
“Add new module to watchlist.” This guide uses a dummy Hello World kernel
object module named hello.ko. In the dialogue box, type the desired object
module without extension files. e.g. “hello”. Check the Break at Init checkbox to suspend the target once
the module is loaded.
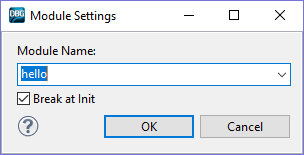
Figure
15: Adding hello.ko to
watchlist
In the debugger console window enter the command
SET DIRECTORY
"kernel_module_path"
Replace kernel_module_path with
the actual directory of the module on the host PC. This enables the automatic source
and symbol info mapping upon kernel module load.
Afterwards, the
selected module will be placed at the top of the Kernel Module menu with a
glasses icon ![]() to its left. Unpause the target by
to its left. Unpause the target by
clicking on ![]() .
.
Use the terminal to
load the kernel module.
$
insmod hello.ko
If the checkbox “Break at Init” was
checked, the target will stop at the init function. (Occasionally, the terminal
will merely blink after inserting the command. In that case, press ![]() to force stopping. The target will
to force stopping. The target will
stop, resume then stop again at the init function of the kernel module). Test functionality by pressing STEP![]() to see if the debugger moves through the
to see if the debugger moves through the
code as usual.
OCD pinouts (60-pin XDP Connector) – Photo

Important
Notice
Please
contact FlatOak Co., Ltd. via our web-site contact form at:
www.flatoak.com (English) or www.flatoak.co.jp (Japanese)
Flatoak strongly
recommends that the customer uses the XDP header specified by Intel
semiconductor manufacturer. Please refer to the manufacturer’s proper data book
or reference design for information.
FlatOak Co., Ltd. makes no representations
or warranties regarding the contents of this document. Information in
this document is subject to change without notice at any time and does not
represent a commitment on the part of FlatOak.
Copyright Notice
© 2017 FlatOak Co., Ltd. All rights
reserved.
Trademarks
All other brand and product names are
trademarks, service marks, registered trademarks, or registered service marks
of their respective companies.